Comparing Prometheus and VictoriaMetrics SDKs for instrumenting metrics in Go
Edited 30 Oct 2025, ~0700 UTC: Fix prometheus benchmark. Update conclusion based on latest benchmark. Also add that prometheus metric labels can be set before incrementing counter.
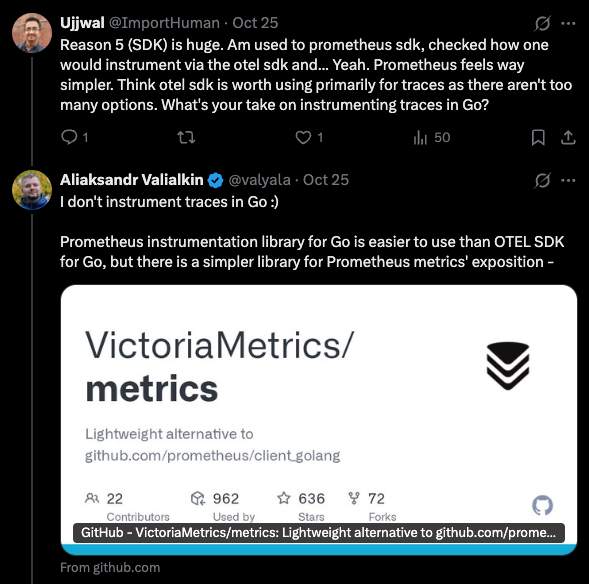
I wanted to do this comparison as a result of this conversation on Twitter (I refuse to call it X), discussing instrumentation in Go and how the OTEL SDK is complex to use (@valyala is the founder and CTO of VictoriaMetrics).
The VictoriaMetrics (henceforth referred to as ‘VM’) SDK looked much simpler to use based on the docs. So I decided to try it, alongside the prometheus SDK. The test setup is simple, a server with a GET API, and a counter that increments on each call.
I defined the metrics - one for prometheus…
import (
	"github.com/prometheus/client_golang/prometheus"
)

var PromRequestsCounter = prometheus.NewCounterVec(
	prometheus.CounterOpts{
		Name: "prom_http_requests_total",
		Help: "Total number of HTTP requests.",
	},
	[]string{"code"}, // metric label names
)

// or alternatively, include the label value during definition:
// var PromRequestsCounter = prometheus.NewCounterVec(
// 	prometheus.CounterOpts{
// 		Name: "prom_http_requests_total",
// 		Help: "Total number of HTTP requests.",
// 	},
// 	[]string{"code"},
// ).WithLabelValues("200")

func init() {
	prometheus.MustRegister(PromRequestsCounter)
}
… and one for VictoriaMetrics.
import (
	"github.com/VictoriaMetrics/metrics"
)

var VMRequestsCounter = metrics.NewCounter(`vm_http_requests_total{code="200"}`)
As you can see, it is much simpler to define a metric using the VM SDK. The labels can be set while creating the metric as part of a natural promQL (or metricsQL, which is VM’s query language, and backwards compatible with promQL, with some additional features. See here). For the prometheus metric, the label values can either be set during increment/addition, or as part of the metric definition itself using WithLabelValues earlier.
func GetHandler(w http.ResponseWriter, r *http.Request) {
	// Increment the counters
	PromRequestsCounter.WithLabelValues("200").Inc()
	VMRequestsCounter.Inc()

	w.Header().Set("Content-Type", "application/json")
	w.WriteHeader(http.StatusOK)
	json.NewEncoder(w).Encode(map[string]string{"message": "Hello, World!"})
}
For setting up the HTTP server
We can start a server for the GET handler, as well as serving endpoints for metrics. Both prometheus and VM will need their own.
func main() {
    r := chi.NewRouter()
    r.Use(middleware.Logger)

    r.Get("/", GetHandler)

    // Endpoints for serving metrics
    r.Handle("/metrics", promhttp.Handler())
    r.HandleFunc("/vm-metrics", func(w http.ResponseWriter, r *http.Request) {
        metrics.WritePrometheus(w, true)
    })

    log.Println("Starting server on port 3000...")
    http.ListenAndServe(":3000", r)
}
When we do GET localhost:3000/, both metrics will get incremented.
This simplicity I felt is the main trade-off between the 2 SDKs. While VM makes it a one liner to define a new metric, if there are labels involved, their names and values must be given explicitly along with the metric name. This can be in 2 ways - either defining and keeping track of a new counter for every label combination that you have, or the much simpler way the docs suggest, which is just before usage, use the GetOrCreateCounter method, which returns the counter if it exists, or creates a new one.
// Dynamically construct metric name and pass it to GetOrCreateCounter.
name := fmt.Sprintf(`vm_http_requests_total{code="%d"}`, code)
metrics.GetOrCreateCounter(name).Inc()
For prometheus, you define the metric once, and only provide label values (if they haven’t been specified during definition).
PromRequestsCounter.WithLabelValues("200").Inc()
PromRequestsCounter.WithLabelValues("400").Inc()
PromRequestsCounter.With(
	prometheus.Labels{
		"code": "500",
	},
).Inc()
For prometheus, when not including values in definition, I prefer the latter With() function as it explicitly requires label names and values. If any labels need to be omitted, they are simply not added while incrementing (kept empty). The WithLabelValues function on the other hand, requires specifying all label values in the order in which they were added during metric initialization. This includes passing empty values for unwanted labels. Straightforward enough with one label, recipe for disaster with multiple.
Benchmarking
For fun, I decided to benchmark the counter increment for both SDKs.
import (
	"testing"
)

func BenchmarkPrometheusCounter(b *testing.B) {
	promCounter := PromRequestsCounter.WithLabelValues("200")
	for i := 0; i < b.N; i++ {
		promCounter.Inc()
	}
}

func BenchmarkVictoriaMetricsCounter(b *testing.B) {
	for i := 0; i < b.N; i++ {
		VMRequestsCounter.Inc()
	}
}
Results? Pretty similar.
goos: darwin
goarch: arm64
cpu: Apple M3
BenchmarkPrometheusCounter-8        	361235923	         3.303 ns/op	       0 B/op	       0 allocs/op
BenchmarkVictoriaMetricsCounter-8   	346361204	         3.492 ns/op	       0 B/op	       0 allocs/op
PASS
The older benchmark below included setting the label value inside the benchmark loop, which drove up the time for prometheus. Without it, the performance is similar for the increment itself.
Older benchmark
For fun, I decided to benchmark the counter increment for both SDKs.
import (
	"testing"
)

func BenchmarkPrometheusCounter(b *testing.B) {
	for i := 0; i < b.N; i++ {
		PromRequestsCounter.WithLabelValues("200").Inc()
	}
}

func BenchmarkVictoriaMetricsCounter(b *testing.B) {
	for i := 0; i < b.N; i++ {
		VMRequestsCounter.Inc()
	}
}
The results? VM increment is way faster.
goos: darwin
goarch: arm64
cpu: Apple M3
BenchmarkPrometheusCounter-8        	28968333	        37.00 ns/op	       0 B/op	       0 allocs/op
BenchmarkVictoriaMetricsCounter-8   	352967086	        3.382 ns/op	       0 B/op	       0 allocs/op
This is something I expected, considering the simpler SDK, and also since VictoriaMetrics in general tends to heavily focus on performance. Both increments are in nanoseconds though, so unless you’re operating at very high scale with frequent invocations, you’re unlikely to feel the difference.
Conclusion
What should you use? Well, like most engineering decisions, the answer is, it depends.
The VictoriaMetrics SDK is very simple to use with its one liner definitions. Note that the docs call out:
this SDK does not implement the advanced functionality that the prometheus SDK does.
If you prefer to have said advanced functionality as an option, the prometheus SDK offers them, with handy functions to provide label values at a time of your preference.
Regardless of which one you choose, if performance is a concern, the recommended approach is to pre-define metrics with their label values. Also, I suggest defining label names (and metric names if multiple metrics are being created with same name and different labels) as constants so any changes are limited and easy to propagate.